A Finance Team Playbook for AI Variance Analysis Using a KPI Flux Tree
Jamie

Build a KPI flux tree that explains every material variance
Variance analysis breaks down when the team is stuck reconciling numbers instead of explaining them. The fix isn’t another spreadsheet tab—it’s a repeatable structure that ties every change in a KPI to a small set of business drivers, with clear thresholds for what matters and what doesn’t. A KPI “flux tree” does exactly that: it turns a top-line delta (for example, revenue up $1.2M week over week) into a traceable set of branches that sum back to the total and can be narrated consistently.
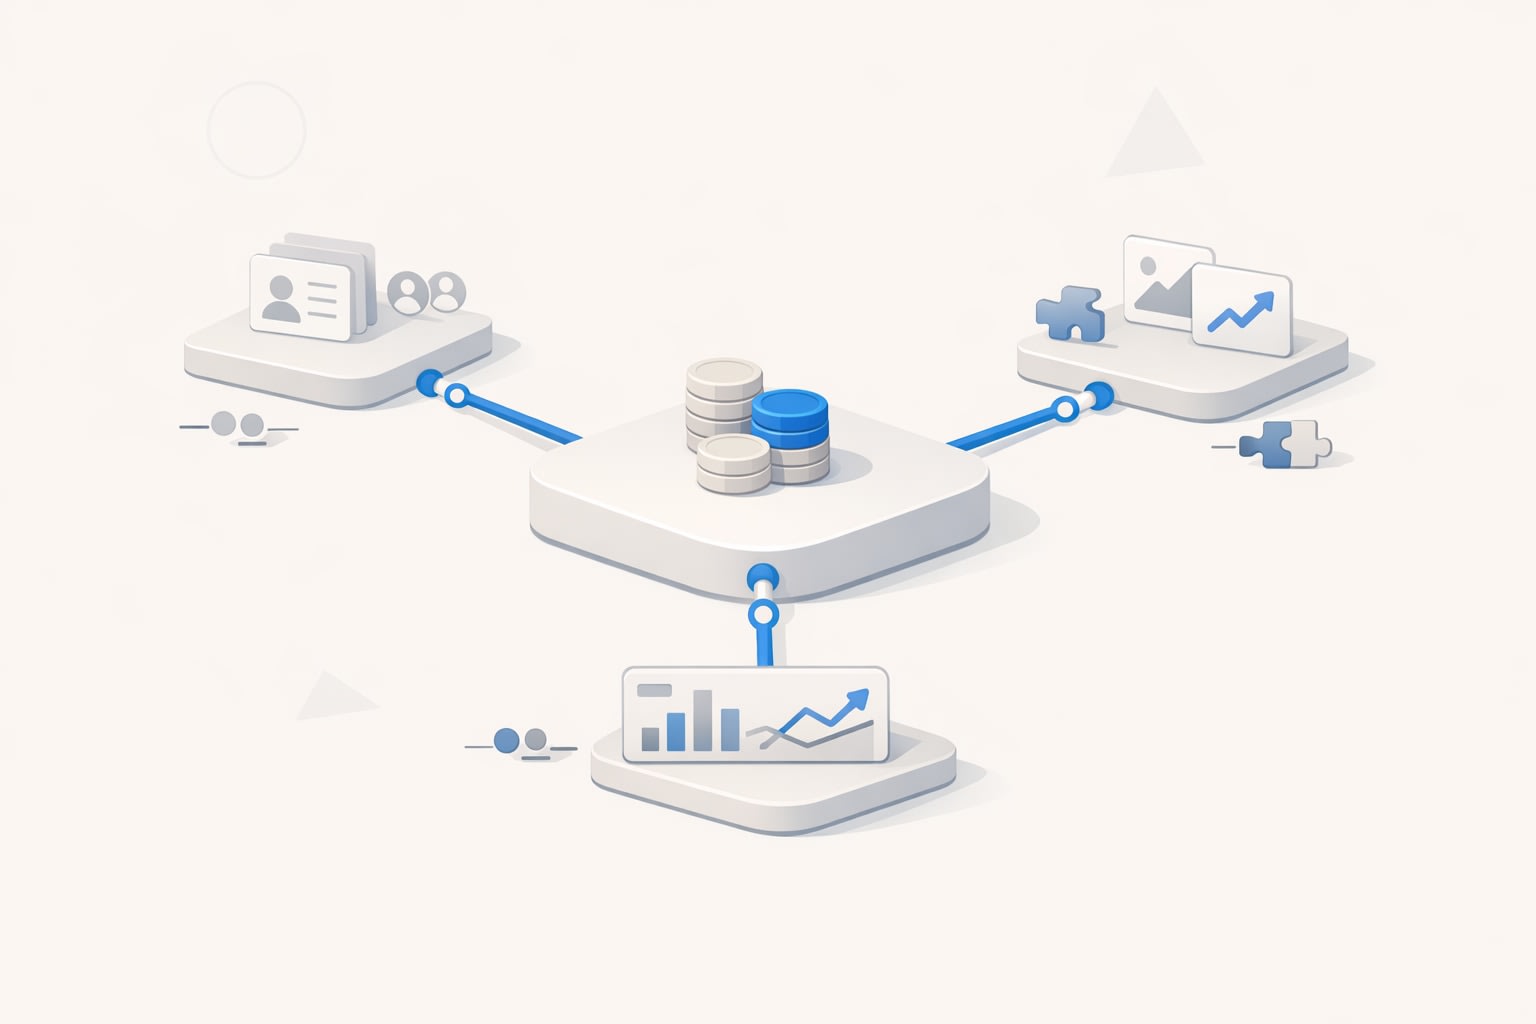
Modern finance teams increasingly use AI to make this workflow both faster and more auditable. The goal is not to “let AI write commentary,” but to let AI do the mechanical decomposition, drill-path exploration, and draft narrative generation—while finance owns definitions, materiality, and final messaging. Platforms like Concourse are designed for this: they connect to ERPs, billing, payroll, CRMs, and warehouses, then produce analysis with data traces and transparency into underlying logic so the team can trust what’s being summarized.
What a flux tree is and why it outperforms ad hoc variance drills
A flux tree is a structured decomposition of a KPI change into mutually exclusive, collectively exhaustive drivers. It answers three questions in order:
- What changed? The KPI delta between two periods (week/week, month/month, actual vs budget).
- Why did it change? A driver hierarchy that breaks the delta into explainable components.
- So what? A narrative that ties the drivers to operational reality, risks, and actions.
Compared with ad hoc pivot-table drilling, flux trees enforce consistency. They also reduce “analysis debt”—the repeated work of recreating the same decompositions every week with slightly different filters and slightly different assumptions.
Step 1 Define the KPI and a driver hierarchy that will not change every week
Start with one KPI and design its driver tree so it remains stable across cycles. Stability is what enables automation and comparable narratives.
Example KPI trees finance teams can standardize
- Revenue: Price × Volume, then split Volume into New vs Expansion vs Churn/Contraction; optionally split by product, region, segment.
- Gross margin: Revenue drivers plus COGS drivers (unit costs, vendor mix, freight, hosting, labor allocation).
- Operating expense: Headcount × average cost + non-payroll categories; break headcount into hires, attrition, and role mix.
- Cash: Beginning cash + operating cash flow + investing + financing; operating cash flow branches into AR, AP, inventory, deferred revenue, payroll timing.
The hierarchy should mirror how leadership actually makes decisions. If the exec team thinks in “new logo bookings” and “net revenue retention,” then the flux tree should be built around those drivers—not around whatever accounts happen to be easiest to query.
Step 2 Set materiality rules that drive focus and prevent narrative noise
A flux tree can generate hundreds of leaf-level variances. Materiality rules keep the output readable and help the team avoid over-explaining small fluctuations.
Define materiality using a combination of:
- Absolute threshold (e.g., >$50k week/week)
- Relative threshold (e.g., >5% of KPI or parent node)
- Rank-based threshold (e.g., top 5 drivers, plus any driver above threshold)
- Exception rules (always include drivers tied to strategic initiatives or known risks)
These rules are where finance judgment lives. Once codified, they can be reused by AI agents to generate consistent weekly output.
Step 3 Map each branch to the right data source and definitions
Flux trees fail when the numbers don’t reconcile or when each team uses different definitions. Before automating anything, define:
- Source of truth for each metric (ERP for GL, billing for invoices, CRM for pipeline, payroll for headcount cost, warehouse for modeled metrics).
- Dimensional grain (customer, invoice line, SKU, cost center, employee) needed to support the drivers.
- Metric logic (recognition timing, FX handling, allocation rules, one-time adjustments).
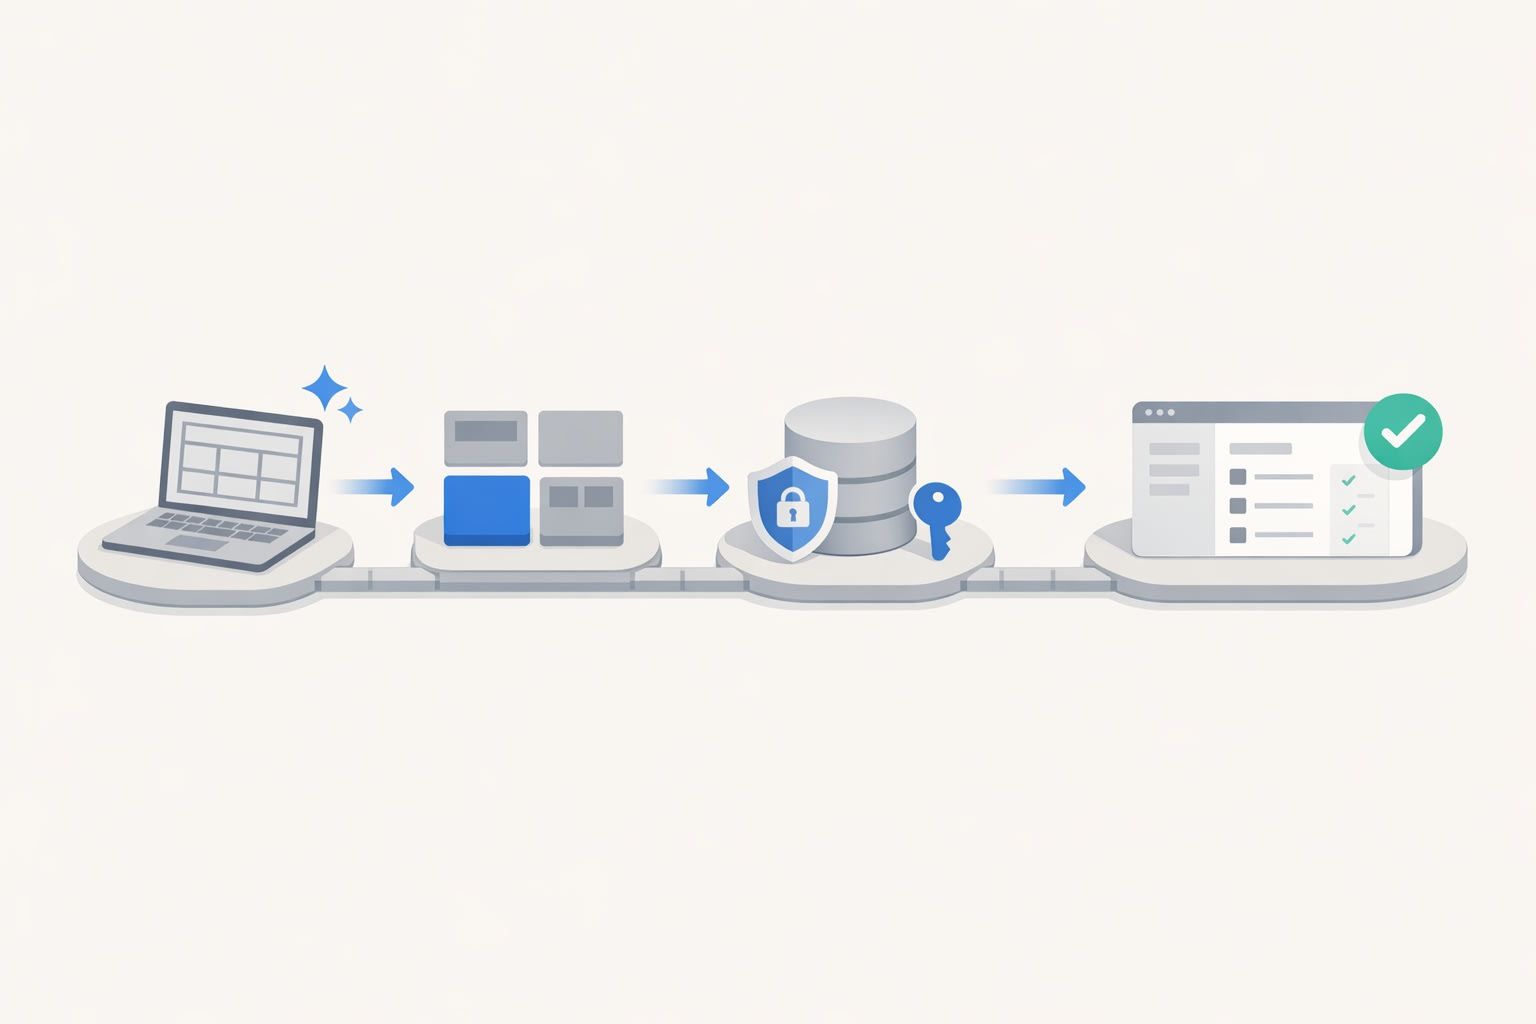
Tools like Concourse help here because the same environment can query across systems and preserve a trace from narrative back to underlying tables and logic. That traceability matters when a CFO asks, “Where exactly did that $180k come from?”
Step 4 Compute the decomposition so every leaf sums back to the total
Every flux tree needs reconciliation discipline: the sum of the drivers must equal the KPI delta (within a defined tolerance). This is what turns a narrative into a controllable finance process.
Common decomposition methods include:
- Additive splits: break a delta into components that naturally add (e.g., Opex by department).
- Price-volume-mix: isolate rate vs quantity vs mix effects for revenue or COGS.
- Waterfall logic: a staged approach where each step explains part of the movement and leaves a remainder for the next stage.

When AI is used, the best practice is to lock the method (for example, a specific price-volume-mix formula) and let the system apply it consistently, rather than “discovering” a new method each week.
Step 5 Auto-generate weekly narratives that read like finance wrote them
Once you have a reconciled flux tree and materiality rules, narrative generation becomes a deterministic workflow:
- State the headline movement with context (week/week, vs plan, vs forecast).
- Explain the top drivers in order of impact, using consistent language.
- Add operational interpretation (what happened in the business, what’s repeatable vs one-time).
- Flag risks and actions (what to watch next week, who owns follow-up).
The difference between “AI-generated text” and “finance-grade commentary” is controlled vocabulary and reusable templates. For example, expansion revenue should always be described using the same definition and paired with the same supporting cut (top customers, product lines, or segments).
Concourse’s Analyze and Report capabilities are built for this style of workflow: generate charts and commentary together, schedule recurring outputs for weekly business reviews, and export to formats finance already uses (PowerPoint, Excel, PDF, and more) while keeping the analysis reproducible.
Step 6 Operationalize the playbook as a weekly cadence
A flux tree only creates leverage when it’s embedded in the weekly rhythm:
- Day 0–1: Data refresh and automated variance computation across KPIs.
- Day 1: Finance review of top drivers, reconciliation checks, and exception handling.
- Day 2: Narrative review with business partners; finalize actions and owners.
- Day 2–3: Publish WBR pack and archive outputs for auditability and trend comparison.
Two practical controls keep the process clean: maintain a prompt library or template library for consistent narration, and capture “memories” (approved explanations, recurring one-time items, business context) so next week’s narrative starts from institutional knowledge rather than blank-page drafting.
Common pitfalls and how to avoid them
- Changing definitions midstream: lock metric definitions and document adjustments; otherwise week/week storytelling becomes incoherent.
- Over-branching: if every node has ten children, narratives become unreadable; enforce a maximum branch factor and use “Other” intelligently.
- No reconciliation: if the driver sum doesn’t tie to the KPI delta, stakeholders will stop trusting the analysis.
- Commentary without actions: require at least one action or monitoring item for material drivers; otherwise it’s just reporting.